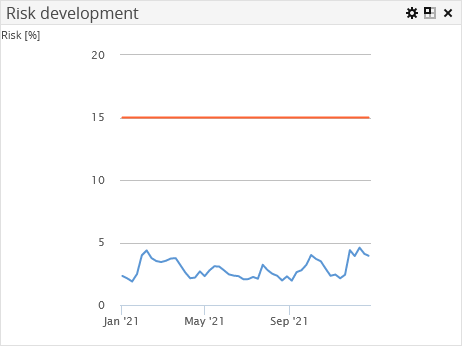
"Risk development" client widget

The "Risk development" client widget shows the development of the holder's risk over the course of time. The vertical axis shows the client's risk percentage in the specified interval.
Point to the chart graph to view the exact value at a price time.
If a risk limit is specified in the portfolio properties of a holder, then this is shown as a red line in the chart. In the example above, you see a risk limit, 7% to June 2015 and 5% from the 1st of July 2015.

Element | Description |
|---|---|
Start date | Enter the start date for the analysis, if necessary. The default setting is the 1st of January in the current calendar year. |
Currency | Select here another currency, if necessary. |
Interval | Select whether to calculate from one day to the next (daily), quarterly or for some other interval. The following settings are available:
|
Confidence | Enter the probability that the amount of loss will not be higher than the risk (value at risk) in the forecast period. The default setting is 95%. |
Forecast period | Enter the period for the analysis of the value at risk. The period is entered in periods (trading days), the default setting is 20 trading days. |
Time series analysis period | Use this parameter to define how many periods in the historical time series are to be used for the parameter estimation. The period is entered in periods (trading days), the default setting is 20 trading days. |
Restrict to assessable instruments | If this checkbox is selected (default setting), the VaR is calculated only for assessable instruments, thus ensuring that a value is returned. Non-assessable instruments are simply not included. |
Confirm your configuration by clicking the "Apply" button.
For more information on risk calculation, see the corresponding section in the online help of your Infront Portfolio Manager.
