![]()
Select the "Historical performance" menu item to carry out an exact analysis of the price performance for a security.
Search for the desired security ("DAX XETRA" default setting) and set the relevant analysis period.
The following elements and functions are available:
|
Element |
Description |
|---|---|
|
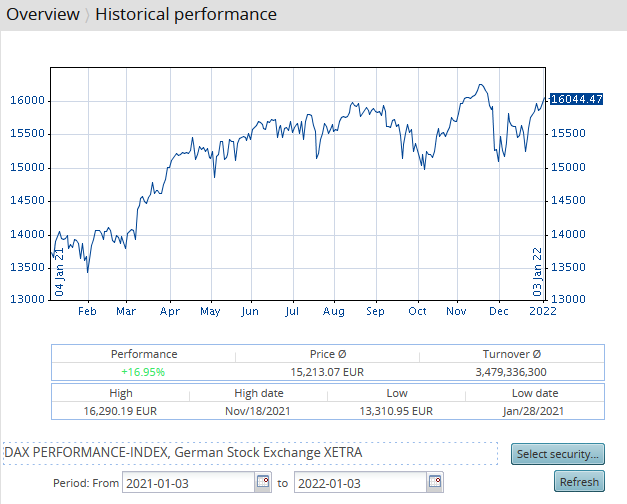
Chart |
The chart of the currently selected security in the currently selected analysis period. Click the chart to switch directly to the security profile. |
|
Performance |
The relative (historical) performance of the security in the period selected. |
|
Price Ø |
The average price in the period selected. |
|
Turnover Ø |
The average turnover in the period selected. |
|
High |
The highest price in the period selected. |
|
High date |
The date on which the highest price in the selected period was quoted. |
|
Low |
The lowest price in the period selected. |
|
Low date |
The date on which the lowest price in the selected period was quoted. |
|
Select security... |
Click this button to select the security to be analysed by using the familiar security search. |
|
Period |
Specify the period by using the "From" and "To" input fields. Use the calendar function to quickly select a date. The default setting is 1 year. |
|
Redraw |
If you have changed the settings, you can update the data and chart with this button. |