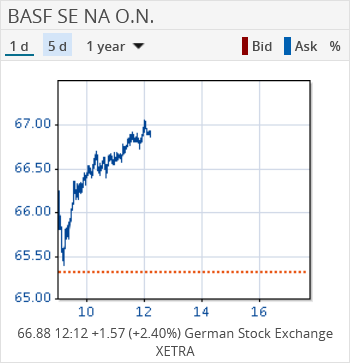
The chart of a security assigned to the news item contains the following elements:
|
Element |
Description |
|---|---|
|
Window title |
In the title, you see the name of the currently selected assigned security. |
|
1 D |
Click this button to display a 1-day chart (intraday). The horizontal line in the chart window of intraday charts indicates the previous day's closing price. |
|
5 D |
Click this button to display a 5-day chart (intraday). |
|
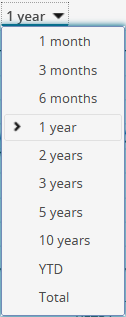
"Period" drop-down list |
From this drop-down list, select the period to be displayed for historical charts: In historical charts, the corresponding moving average is plotted. |
|
Bid |
Displays the bid price in intraday charts. |
|
Ask |
Displays the ask price in intraday charts. |
|
B |
Displays a benchmark in historical charts. |
|
C |
Enabled by default (indicated by the frame of the button). Includes or excludes the corporate actions in historical charts (included by default). |
|
D |
The checkbox is cleared by default. Includes any dividends in historical charts in the chart. This adjusts historical prices. |
|
% |
Switches to the relative display. Restores the original scaling. |
|
Chart window |
In the chart window, the price is displayed as a line. Below, you can see the current price with time, absolute and percentage change as well as the trading venue. Clicking the chart window opens the Chart Center for this security, where you have many more options for technical analysis. |