
-
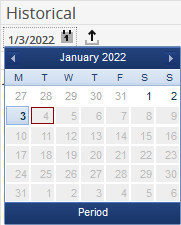
On the left, the "Historical" table contains by default the end-of-day data retroactively from the current date. Using the integrated calendar above the table, you can select a different analysis date. Then 34 dates in the past are displayed from this date.
-
On the right side, you see by default the intraday data of the current trading day in 30-minute steps with the number of included ticks. Example: 09:00–09:30 – 231 ticks.
-
-
Select a day in the historical area on the left side of the screen with a click, then the intraday view is displayed on the right side for this selected day.
-
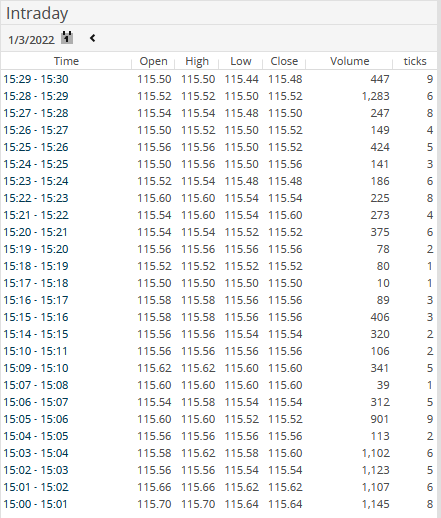
If you select such a 30-minute interval again in the "Intraday" table, a table with a resolution on a minute basis is displayed for this period.
-
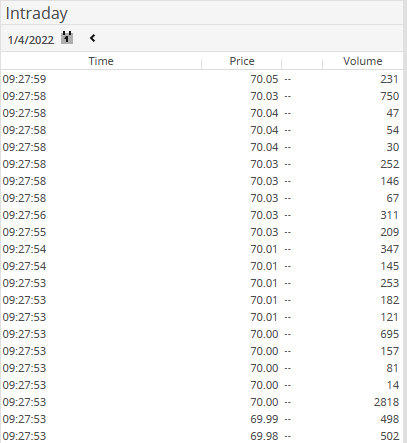
If such a minute interval is selected, the contained individual ticks are listed with volume information.
-

-

-
