
If the table templates in Infront Portfolio Manager also contain graphics (such as the asset overview or also the regional, sector or asset class analysis), these are also shown in Infront Advisory Solution. Pie and column charts are available.
A table can also have several graphics. The graphics are shown below the table in the analysis area.
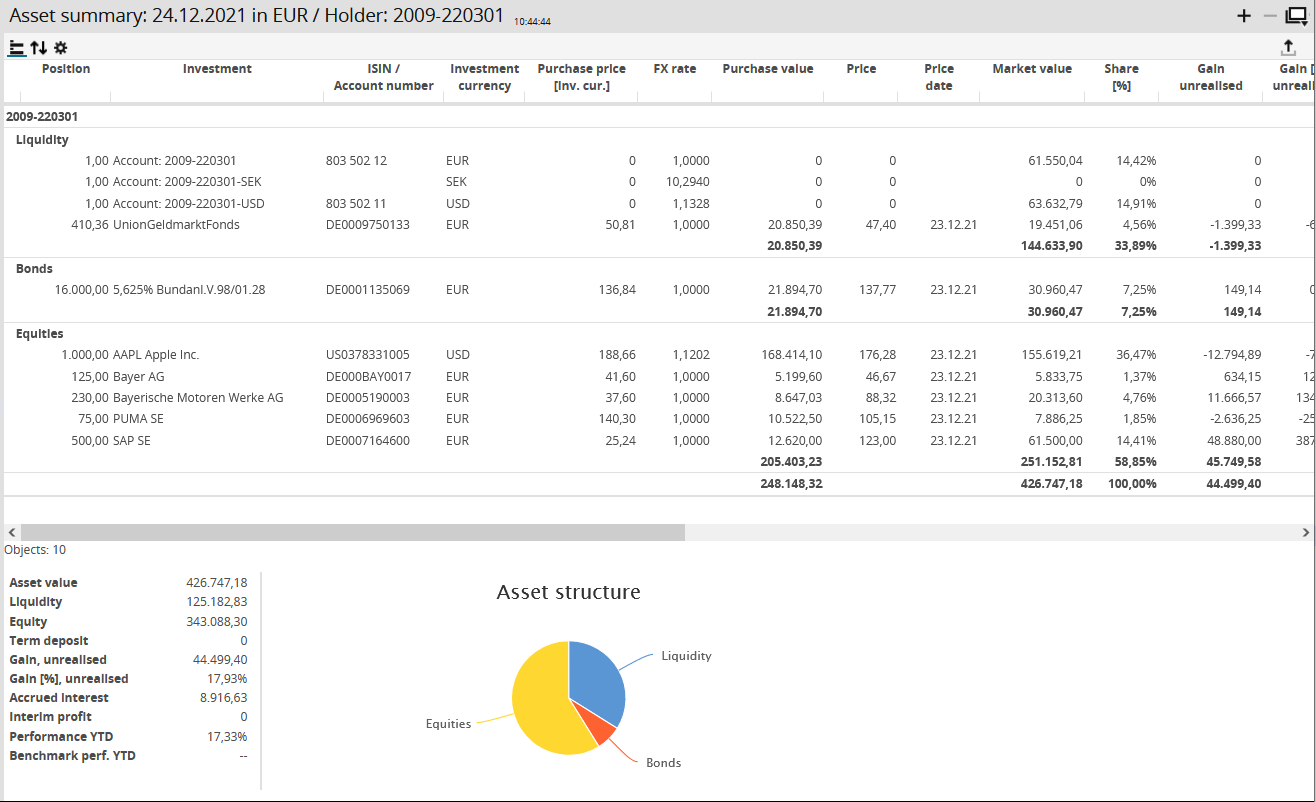
By pointing to a section of a pie chart, this section (including the corresponding legend entries) is highlighted.

You can change the size of the table by pulling the line separating table and graphic. By using the arrow icon in the top-right corner of the graphic window, you can minimise it again.