

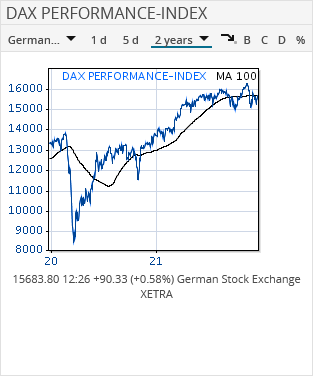
The "Chart" market data widget shows the current charts and the moving average for the selected security. Below the chart, you see information on the price, the absolute and percentage change relative to the close and the current selected trading venue.

Confirm your configuration by clicking the "Apply" button.
You can configure the chart any time. The following individual settings are possible:
|
Element |
Description |
|---|---|
|
|
Select a different trading venue, if necessary. If several trading venues are available, then open the drop-down list by clicking the arrow symbol. |
|
|
Click this icon to set an intraday chart. |
|
|
Click this icon to set a 5-day chart. |
|
|
Select the chart period from the drop-down list. You can select from the following periods:
|
|
|
Switches to the security profile of this security. |
|
|
Displays a benchmark. This function is not available for intraday and 5-day charts. |
|
|
Takes into account possible corporate actions in the chart. This function is not available for intraday and 5-day charts. |
|
|
Takes into account possible distributions (for example, dividends). The historical time series are adjusted accordingly. This function is not available for intraday and 5-day charts. |
|
|
Sets the y-axis to percentage. Click the icon again to set absolute values. |


The current configuration is indicated by the corresponding icons in the toolbar of the widget.

In this example, the header of a 6-month chart with included corporate actions (trading venue "Xetra") is displayed.
You can save applied changes only in the edit mode of the dashboard.